Langfuse: Observability for LLM Applications
After an LLM app ships, developers quickly learn that a single user request often passes through prompt assembly, multiple model calls, RAG retrieval, tool use, and Agent decisions. When something goes wrong, you only see a bad final answer and struggle to tell which step drifted. Langfuse is an open-source observability platform built for that kind of black-box problem.
What is Langfuse
Langfuse is an open-source LLM engineering / LLMOps observability platform for building, monitoring, debugging, and improving large-language-model apps and AI agents. It centers on Tracing: every model call, tool run, retrieval result, and state change inside a request is recorded as a structured Trace so teams can debug LLM pipelines the way they debug traditional microservices.
Compared with LangSmith, which also targets LLM observability, Langfuse’s biggest difference is open source and self-hosting. LangSmith is a closed-source SaaS product from the LangChain team—capable, but usage-based past the free tier, and not fully deployable in a private environment. Langfuse is fully open under the MIT license, auditable in the open; you can use hosted Langfuse Cloud or self-host for free on your own infrastructure, with full control over data and cost.
You can use the project in two ways:
- Langfuse Cloud: Official hosted SaaS, good for a quick start or small teams.
- Self-Hosted: Private deploy with Docker Compose or Kubernetes, no Langfuse license fee, data stays on your infrastructure.
Whether you call OpenAI / Anthropic / local models directly or go through LangChain, LlamaIndex, OpenTelemetry, and similar stacks, Langfuse can capture the important telemetry with relatively low instrumentation cost.
Core features
Langfuse’s capabilities follow three themes—observe, evaluate, iterate. The main modules are below.
Tracing
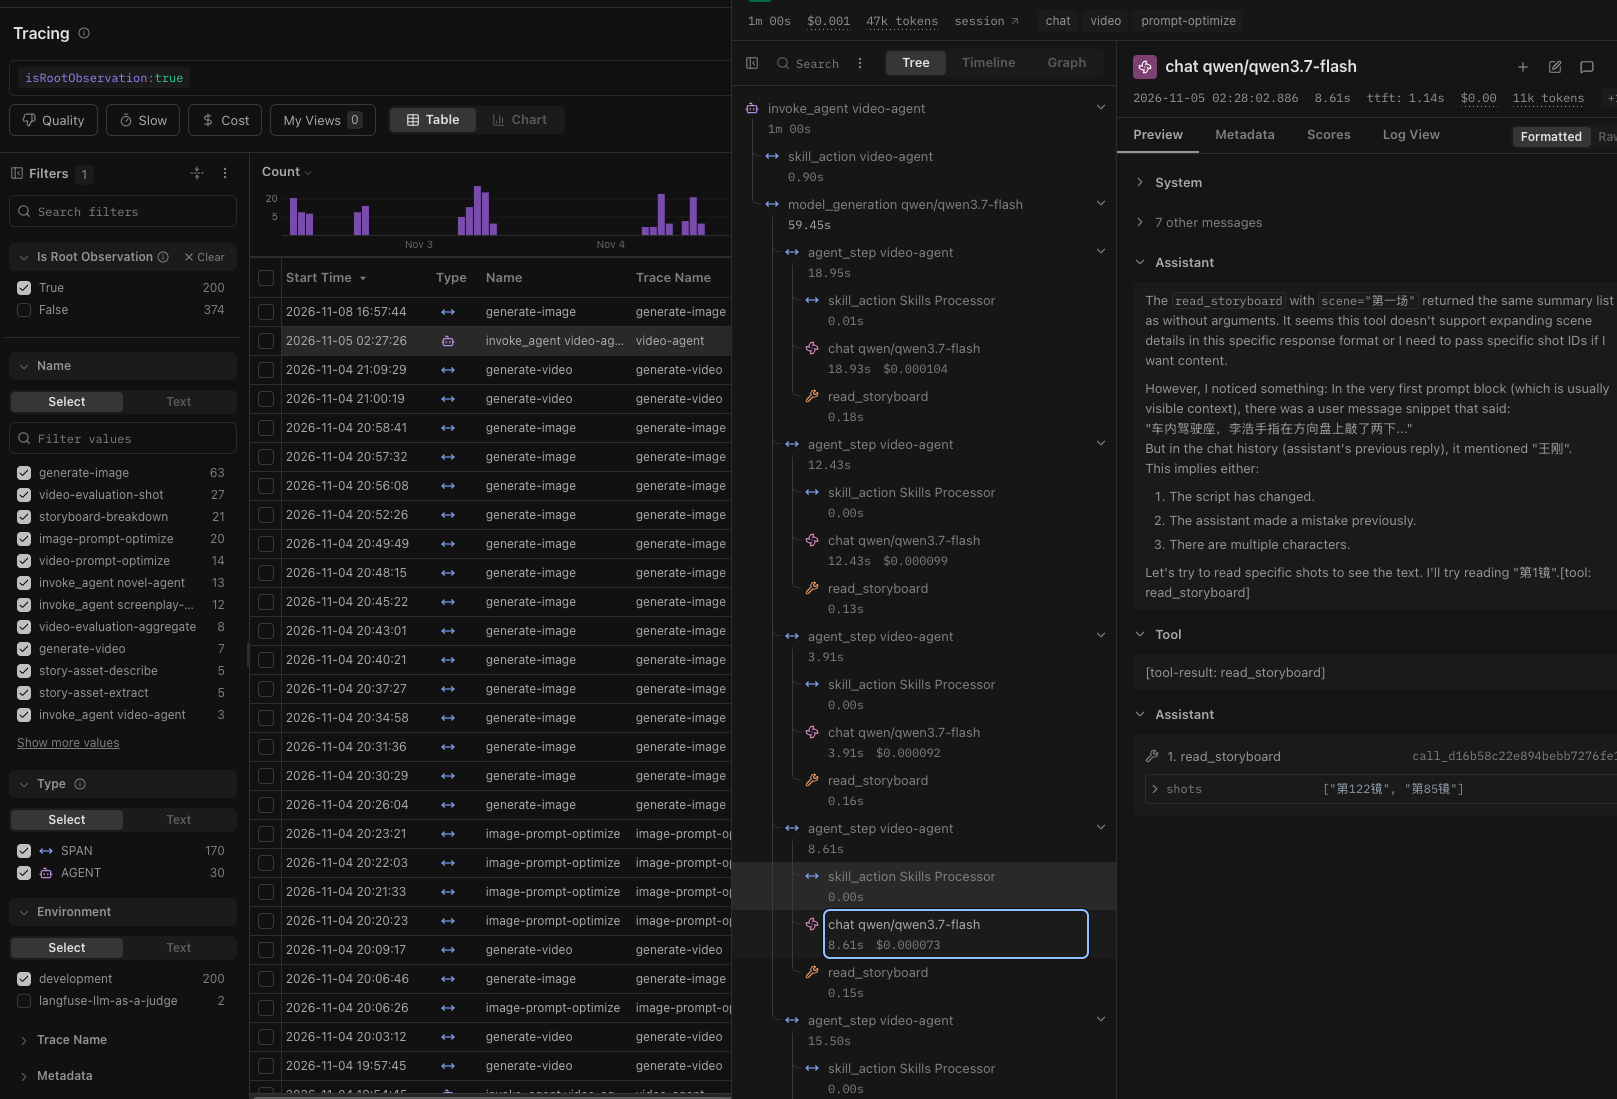
Tracing is the foundation. Each user request maps to one Trace, broken along a timeline into Spans and Generations:
- Generation: One LLM call—prompt input, model parameters, output, token usage, and latency.
- Span: Any business step, such as RAG retrieval, tool calls, or knowledge-base queries.
- Event: Notable events such as user feedback or errors.
Nested structure makes latency, cost, and intermediate state visible at each stage, so you can find hallucinations, timeouts, or retrieval failures faster.
Metrics
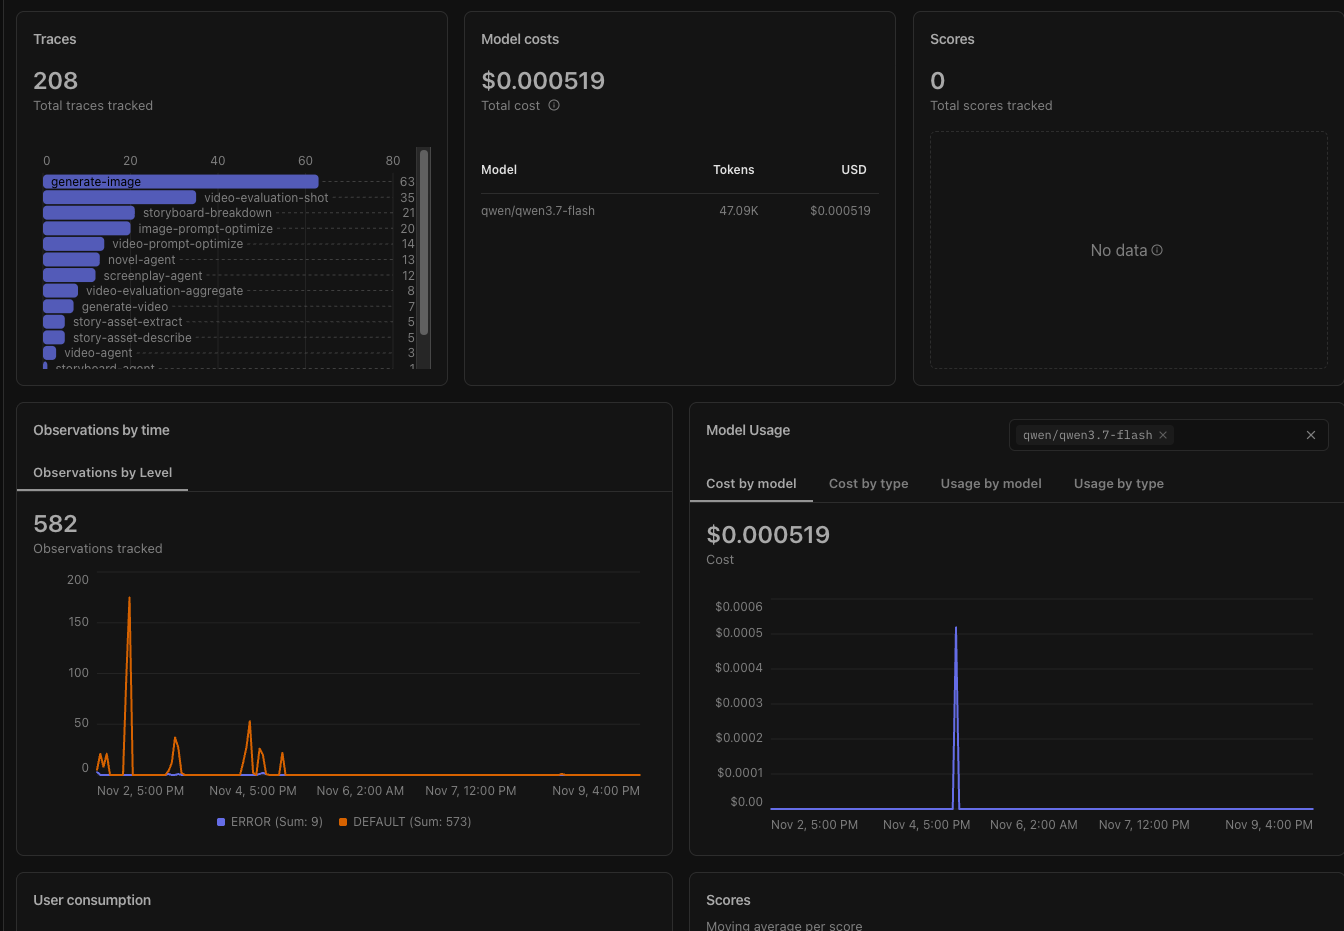
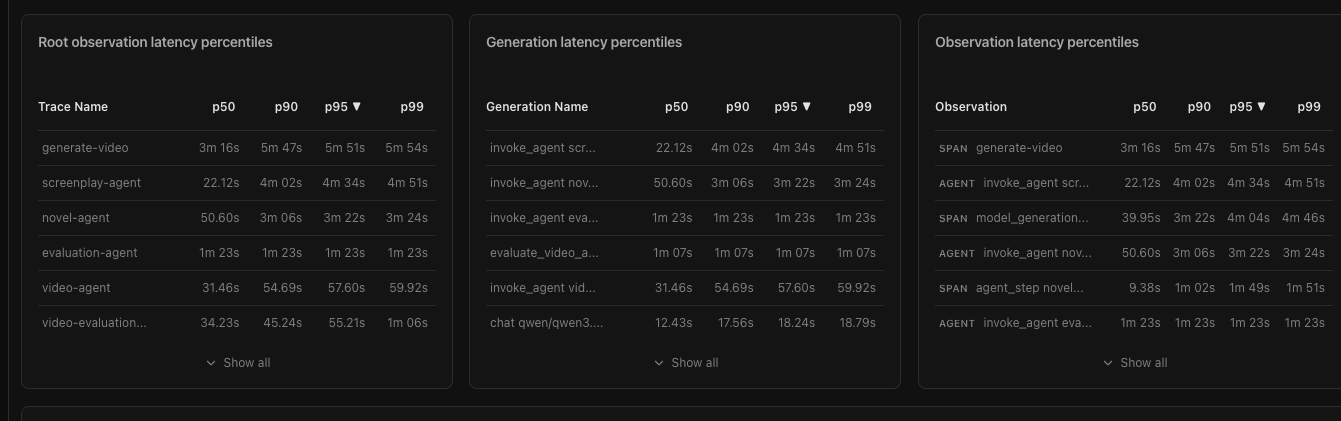
The platform aggregates Trace data into observability metrics:
- Token usage and estimated cost
- Latency distributions (P50 / P95 / P99)
- Error rate and success rate
- Model usage distribution
You can view them in the Dashboard or export via API into Prometheus / Grafana or your BI stack.
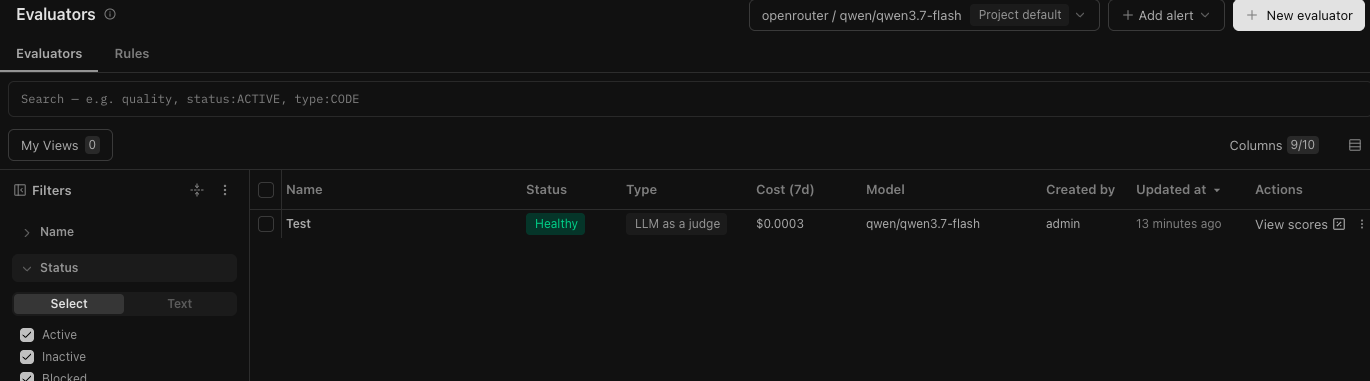
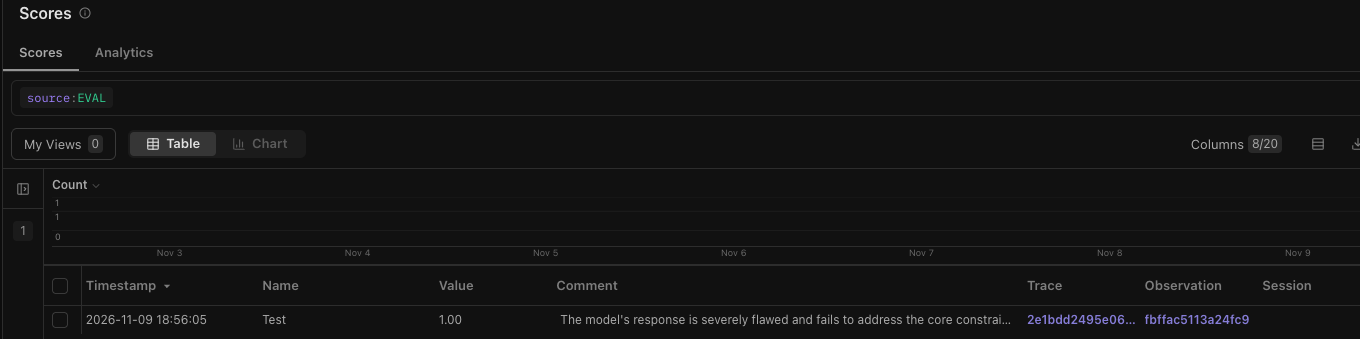
Evals
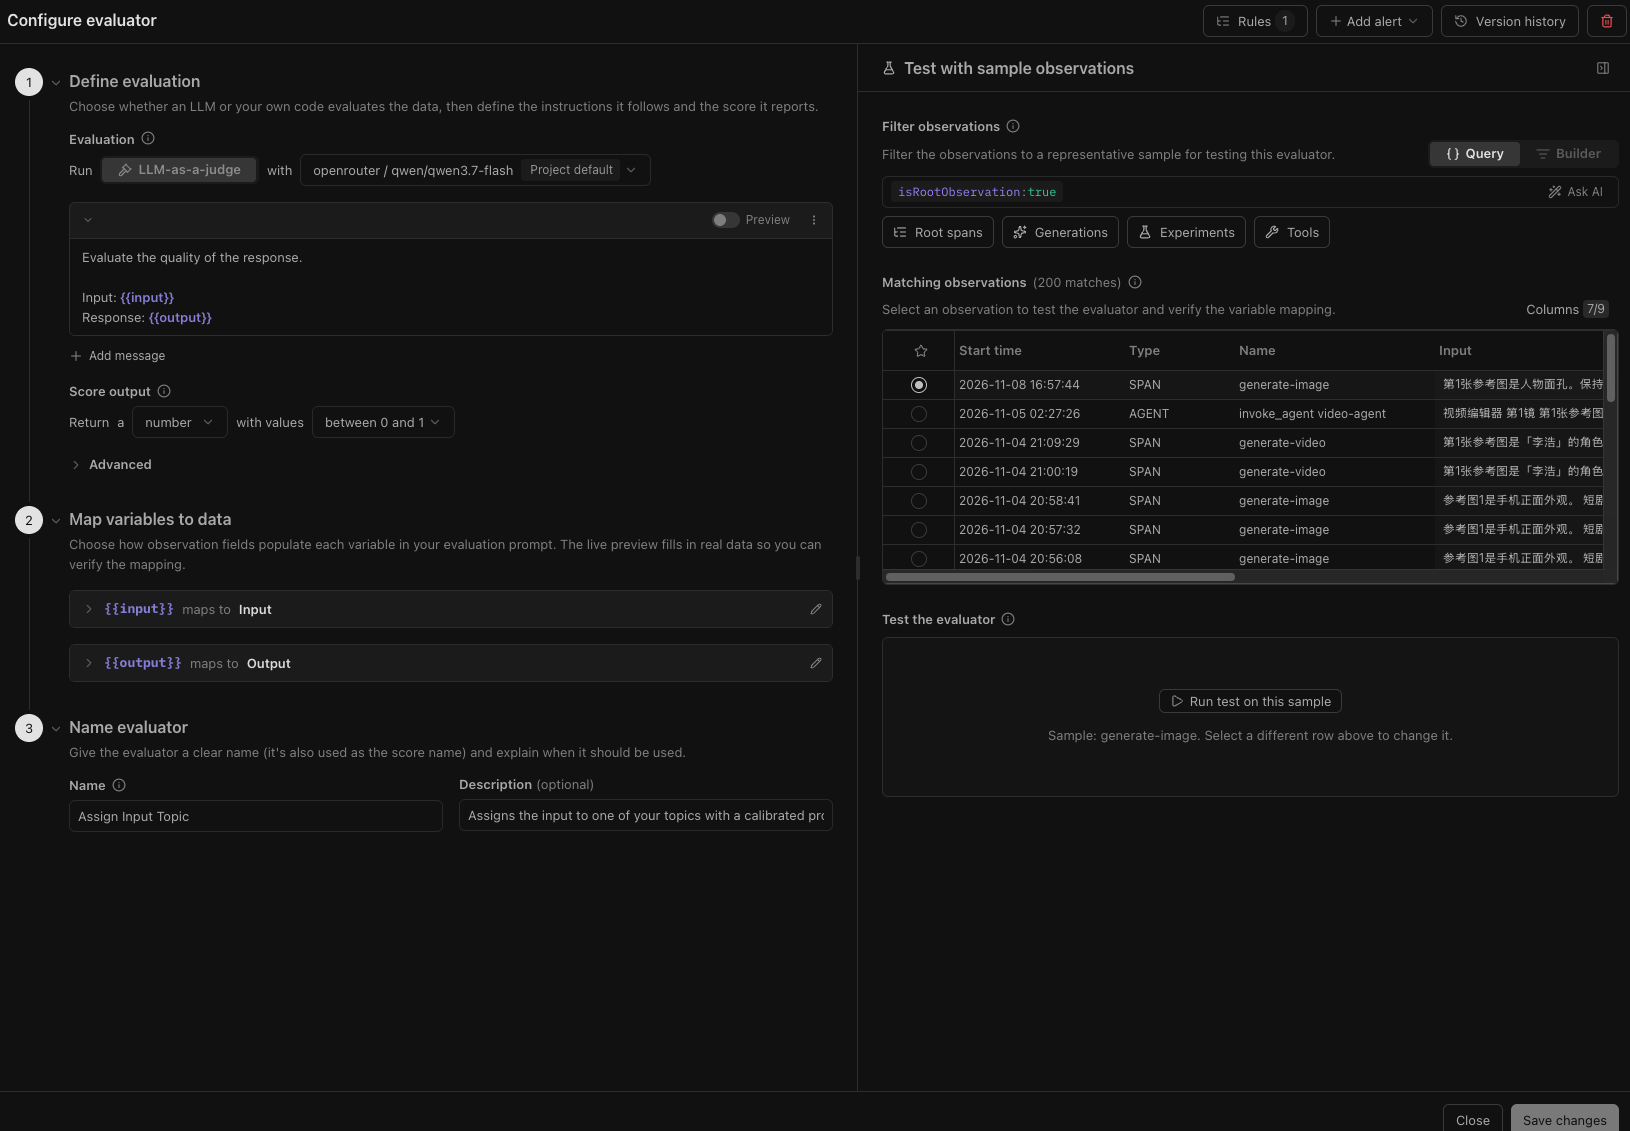
Langfuse splits evaluation into two modes:
- Online: After production traffic arrives, score automatically with rules, LLM-as-a-judge, or custom functions, and attach scores to concrete Traces.
- Offline: Run batch evaluations on datasets for regression tests, A/B comparisons, and prompt-version comparisons.
Results land as Scores on Traces or Generations so teams can quantify model quality and track trends.
Prompt Management
Langfuse provides versioned prompt management:
- Create, edit, and version prompt templates in the UI.
- Call them in code by
prompt_nameandversionso prompts are not scattered across the codebase. - Prompt changes can link directly to Traces, so you can see how version changes affect outputs.
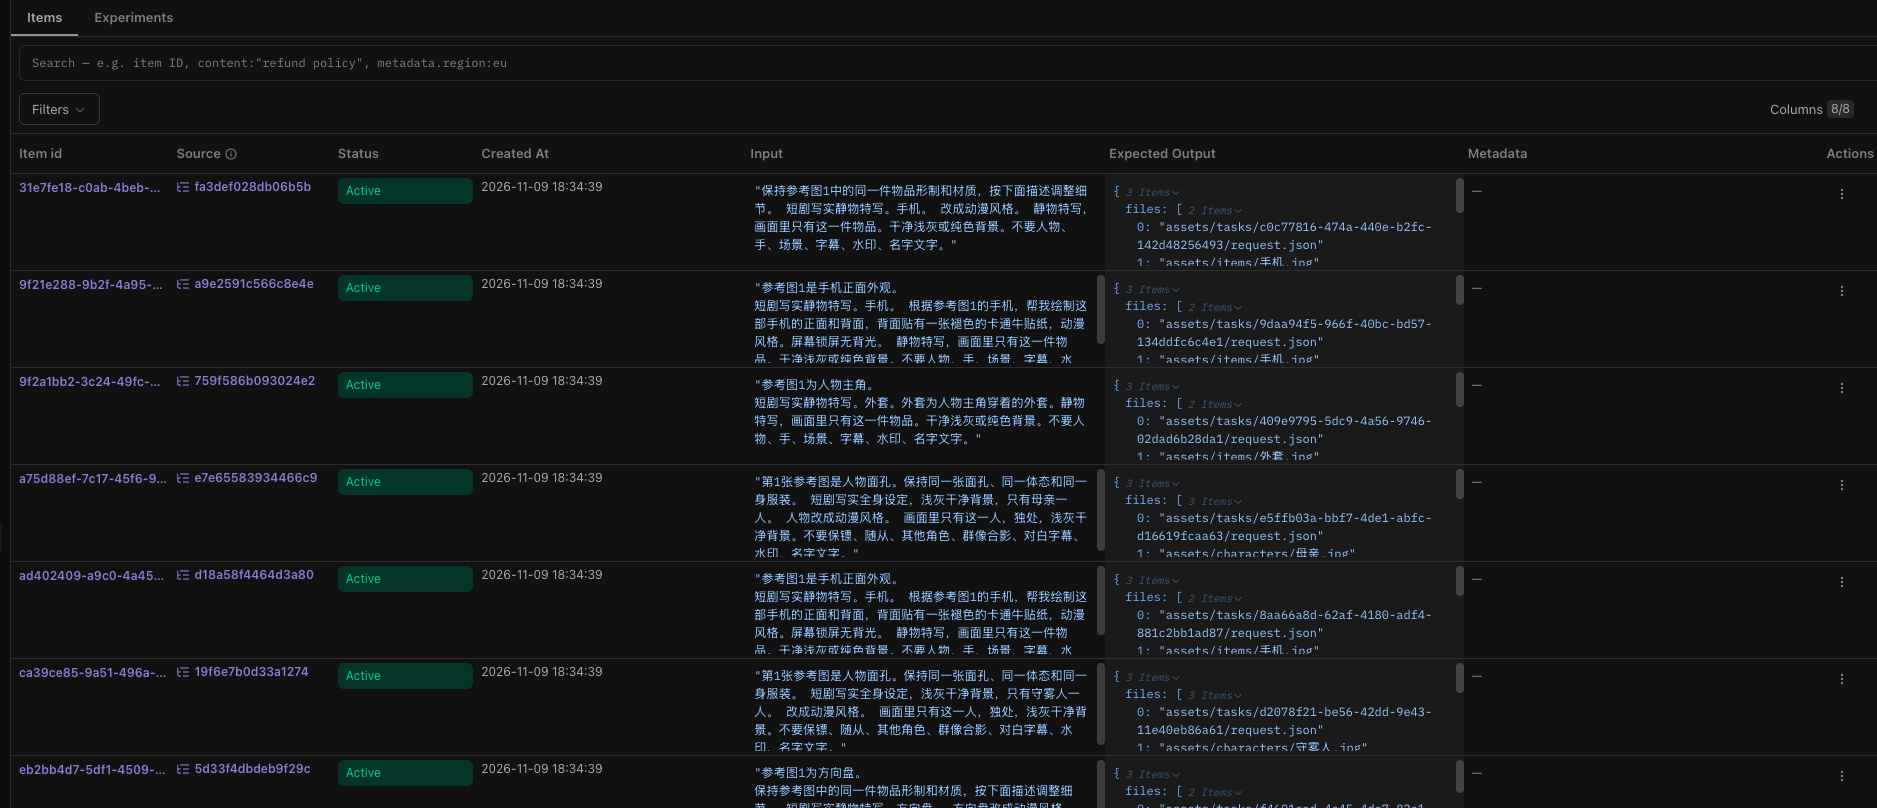
Datasets
Datasets are for test sets and benchmarks:
- Promote bad cases from production Traces into a dataset in one click.
- Replay the same inputs to compare models or prompt versions.
- Wire into CI for automatic regression before prompt or model changes ship.
Install and deploy
Self-hosting Langfuse is Docker-first. Below is the core idea for a local trial and production; for exact image tags and the full variable list, prefer the official self-host docs.
Local quick start
The official recommendation is Docker Compose. A minimal local stack usually includes:
langfuse-web: Web UI and API entrypoint.langfuse-worker: Background jobs (batch writes, evaluation tasks, and so on).postgres: Metadata and project data.clickhouse: Trace and event storage.redis: Job queue and cache.minio: S3-compatible object storage (uploads, images, and similar).
Prepare a .env file:
# Database
DATABASE_URL=postgresql://postgres:postgres@postgres:5432/langfuse

# Distributed storage and queues
CLICKHOUSE_URL=http://clickhouse:8123
REDIS_URL=redis://redis:6379

# S3-compatible object storage
S3_ENDPOINT=http://minio:9000
S3_BUCKET=langfuse
S3_ACCESS_KEY_ID=minio
S3_SECRET_ACCESS_KEY=miniosecret

# Security and encryption (use strong random strings in production)
NEXTAUTH_URL=http://localhost:3000
NEXTAUTH_SECRET=your-nextauth-secret
SALT=your-salt
ENCRYPTION_KEY=your-encryption-key
Then start in the same directory:
docker compose up -d
After the services are up, open http://localhost:3000 to finish setup and create the first project.
Important environment variables
| Variable | Role |
|---|---|
DATABASE_URL |
PostgreSQL connection string for users, projects, prompts, and other metadata. |
CLICKHOUSE_URL |
ClickHouse connection string for large-scale Traces and events. |
REDIS_URL |
Redis connection string for queues and cache. |
S3_* |
Object-storage config; Trace attachments and dataset files depend on it. |
NEXTAUTH_SECRET / SALT / ENCRYPTION_KEY |
Secrets for sessions, password hashing, and encryption—use strong random values in production. |
NEXTAUTH_URL |
Auth callback URL; must match the public access URL. |
Production notes
When moving from a local trial to production, pay attention to:
- External DB and object storage: Use managed PostgreSQL, Redis, and S3; avoid keeping state only inside containers.
- Persistence and backups: ClickHouse and PostgreSQL need regular backups—Trace volume grows quickly.
- High availability: Scale
langfuse-webandlangfuse-workerhorizontally; HA for DB and object storage is separate. - Security:
- Manage encryption secrets (
NEXTAUTH_SECRET,SALT,ENCRYPTION_KEY) via a secrets store; do not commit them to Git. - Put HTTPS and appropriate access control in front of the web service.
- Manage encryption secrets (
- Capacity planning: Trace volume scales with traffic; size ClickHouse and object storage against your retention policy.
If the team is not ready to operate Kubernetes, Langfuse Cloud is the lower-ops option: same product surface, infrastructure hosted by the vendor.
Basic usage
Langfuse ships Python and TypeScript/JavaScript SDKs, and also integrates through OpenTelemetry, LangChain, LlamaIndex, and similar frameworks. The examples below use the Python SDK for a minimal working path.
Get an API key
In the Langfuse web UI, open project settings and create a Public Key / Secret Key pair. For a local deploy the host is http://localhost:3000; for Cloud it is https://cloud.langfuse.com.
Install the SDK
pip install langfuse
Option 1: Call the SDK directly
Use this when you want precise control over Trace structure:
import os
from langfuse import Langfuse

langfuse = Langfuse(
    public_key=os.getenv("LANGFUSE_PUBLIC_KEY"),
    secret_key=os.getenv("LANGFUSE_SECRET_KEY"),
    host=os.getenv("LANGFUSE_HOST", "http://localhost:3000"),
)

# Create a Trace
trace = langfuse.trace(
    name="qa-session",
    user_id="user-123",
    metadata={"source": "web"},
)

# Record an LLM call (Generation)
trace.generation(
    name="openai-answer",
    model="gpt-4o-mini",
    input=[{"role": "user", "content": "What is Langfuse?"}],
    output={"role": "assistant", "content": "Langfuse is an open-source LLM observability platform."},
    usage={"input": 12, "output": 18, "unit": "TOKENS"},
)

# Record a business step (Span)
with trace.span(name="retrieve-docs") as span:
    docs = ["doc-1", "doc-2"]
    span.update(output={"retrieved": docs})

# Flush events before the process exits
langfuse.flush()
Option 2: Auto-trace with a decorator
If you already call OpenAI directly, @observe() can instrument with almost no changes:
import os
from langfuse.decorators import observe
from openai import OpenAI

client = OpenAI(api_key=os.getenv("OPENAI_API_KEY"))

@observe()
def answer(question: str) -> str:
    response = client.chat.completions.create(
        model="gpt-4o-mini",
        messages=[{"role": "user", "content": question}],
    )
    return response.choices[0].message.content

answer("What is Langfuse?")
The decorator creates a Trace for answer, turns inner LLM calls into Generations, and records output, latency, and token usage.
View in the Dashboard
After running the code, open the Langfuse web UI for that project. You should see:
- Traces: Requests on a timeline; open one for the full call chain.
- Generations: All LLM calls, filterable by model, latency, and cost.
- Scores: Manual or automatic scores on Traces to track quality trends.
- Dashboards: Aggregated token use, latency, error rate, and more.
From a Trace you can drill into a Generation and inspect the prompt, model parameters, and raw output to find the root cause faster.
Summary
Good fit for
Langfuse works especially well for:
- RAG apps: You need to connect retrieval, re-ranking, context assembly, and final generation.
- Agent systems: Agents call models, tools, and external APIs many times; Traces show each decision and state change.
- Multi-model strategies: When you call several models or fall back between them, you need latency, cost, and quality side by side.
- Cost-sensitive products: Track tokens per user or session and spot abnormal or expensive traffic.
- Teams that iterate continuously: Tie prompt versions, eval scores, and production feedback into one loop.
How it differs from similar tools
There are many LLM observability tools—LangSmith, Phoenix (Arize), Weights & Biases, and others. Langfuse stands out mainly because:
- Open source and self-hostable: MIT license, Docker and Kubernetes self-hosting, full data ownership.
- Tracing-first: Clear Trace structure with Generation / Span / Event layers for drill-down debugging.
- One platform: Observability (Tracing/Metrics), evaluation (Evals), prompt management, and datasets in one place, less tool sprawl.
- Framework-agnostic: Official SDKs plus OpenTelemetry, LangChain, LlamaIndex, Vercel AI SDK, and more.
Getting started
For teams new to Langfuse, a practical order is:
- Validate on Cloud first: Sign up for Langfuse Cloud, spend ~30 minutes wiring a real endpoint, and confirm Traces look right.
- Cover critical paths: Add the SDK or decorator on core production calls so you can see what matters first.
- Add metadata: Put
user_id,session_id, andmetadataon Traces for later aggregation by user or session. - Introduce evals: Start with simple rule scores or LLM-as-a-judge and build a quality baseline.
- Version prompts: Move critical prompts into Langfuse Prompt Management and link them to Traces.
- Self-host when needed: Move to Self-Hosted when compliance, cost, or customization requirements are clear.
Langfuse is not a “install it and problems disappear” product. It gives you a structured observability vocabulary. The value shows up when the team folds Trace, Eval, and Prompt management into everyday development and iteration.