Using Linux Core Dumps to Quickly Locate Program Bugs
What Is a Core Dump?
A core dump is a mechanism inherited from UNIX. When a program crashes due to an error, it saves a snapshot of the stack, memory, PID, UID, GID, timestamp, and other information, typically used for diagnosis and debugging. Core dump data is usually kept on the machine for about three days (depending on system settings); if you don't track down the bug in time, the system deletes these core dumps after that.
What Tools Do You Need?
Generally, objdump and gdb are all you need. For diagnosis, the original source code is best (the unmodified code from when the core was dumped).
Case Study
Below is a failure case I'm sharing for reference.
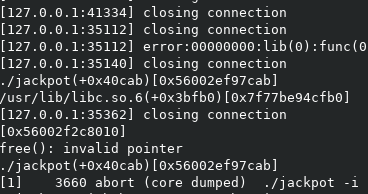
The Program Crashed
This program runs without any problems; it just occasionally crashes on exit. That's the most frustrating kind. Hidden bugs like this don't trigger in most situations, then suddenly happen under some special condition. The dilemma comes down to two things:
- Hard to confirm (whether it happens)
- Hard to locate
See the screenshot below:
Trying to Debug Directly with coredumpctl
coredumpctl is one of the systemd tools; any system using systemd should have it. It is very easy to use. For help, run:
coredumpctl --help
Or read its man page.
Back to the point. Try debugging with:
coredumpctl debug xxxx
xxxx above is the program file name; you can find it with
coredumpctl list.
The result looks like this:
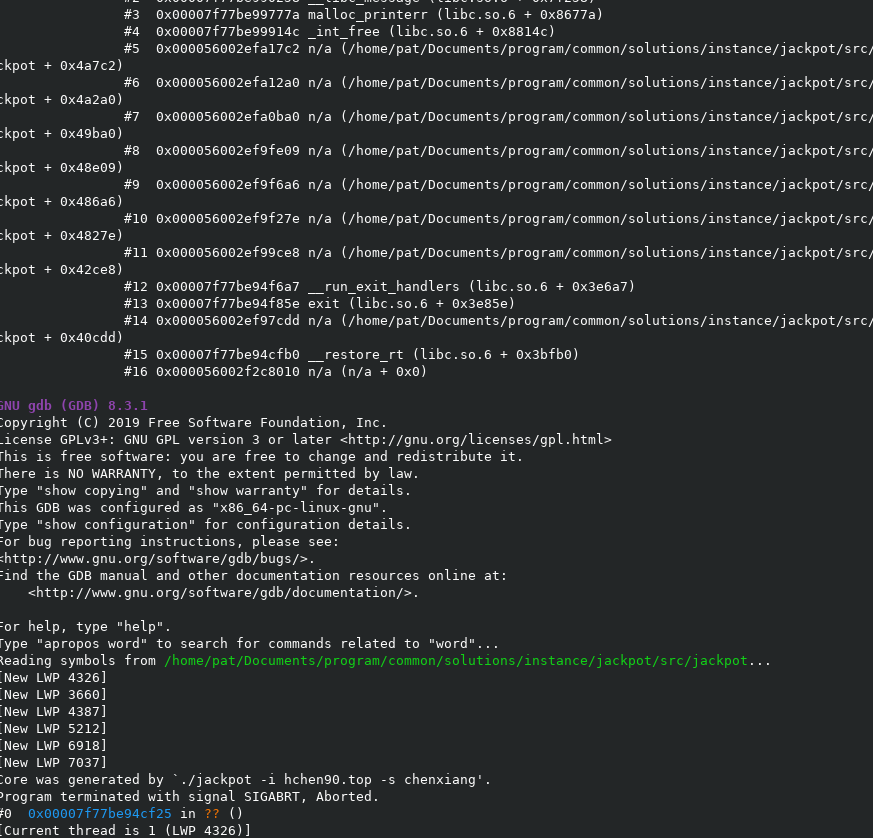
This case is more complicated. Notice the line 0x00007f77be94cf25 in ?? (): the core dump can't pinpoint the faulting location in the source. For comparison, here is another example:
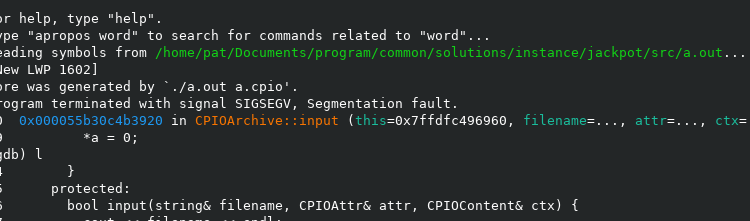
In this example, the core dump immediately identifies the faulting code: the crash clearly happened when executing this line:
*a = 0;
I deliberately broke this for comparison; the source looks like this:
	bool input(string& filename, ...) {
	  cout << filename << endl;
	  int* a = 0;
	  *a = 0;
	  return true;
	}
Now back to the earlier 0x00007f77be94cf25 in ?? (). We can't pinpoint it right away as in the second example, so what now?
Viewing the Stack with coredumpctl info
The two screenshots below show the crashed program's stack.
Figure 1:
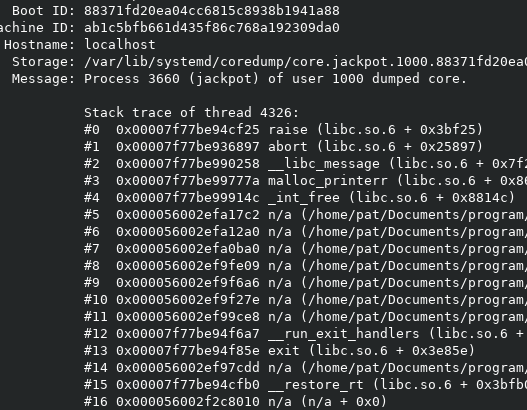
Figure 2:
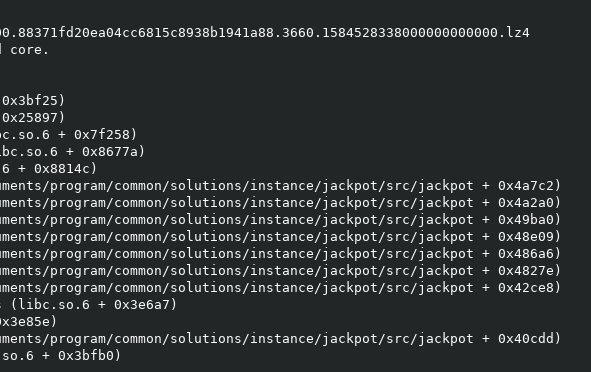
Because the output is wide, I split it into two images. Note the stack call list in Figure 2. Next, we disassemble the original program file.
Disassembling the Program
When disassembling the original crashed binary, don't forget the --source flag; otherwise you get pure assembly and searching is much less efficient. Run:
objdump --source -d xxxx | less
Screenshot:
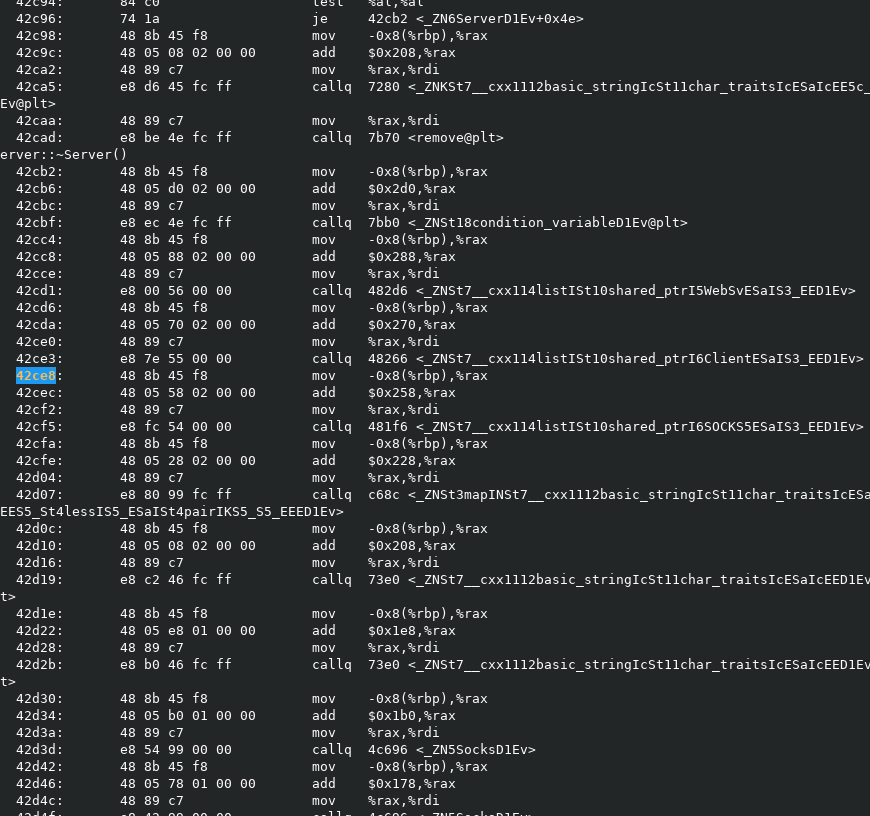
Again, xxxx is the program file name.
Now, in less, search for each stack address in turn (see Figure 2) and go to the first faulting location in the program right after returning from libc, i.e. file offset 0x42ce8. The error is immediately pinned down (following the addresses up the stack, you can tell it's a clear on a list). It turned out to be a C++ class destructor failing while destroying a list. This in turn showed the bug was actually caused by multithreading: a worker thread in the program was also freeing resources, and the main thread and worker thread freed them at the same time without synchronization, so it sometimes worked and sometimes crashed. Adding the simplest synchronization mechanism solved the problem.